Procurement & Supply Chain
3–4 weeks (baseline) + 6–10 weeks (delivery)

Procure-to-Pay (P2P): Stabilisation, Controls, and Automation

P2P exceptions and escalations consumed capacity across procurement and AP. Suppliers lacked reliable payment updates, business stakeholders bypassed the process and control owners used different reason codes and resolution rules. We reset approvals, tolerances, receiving and master-data ownership, then introduced bounded agent support for triage, summaries and communications.

#P2P
#Invoice exceptions
#Controls
#Automation
#AP
Procure-to-pay stabilisation: controls, exceptions, and automation
Enterprise (multi-entity AP)Established a measurable root-cause programme with reason codes, control owners, SLAs and recurrence checks.
Source
Enterprise (multi-entity AP) evidence
Owner
Practice lead
Output
P2P stabilisation and exception reduction
Status
Anonymised case study

Anonymised case study. Focus: treating exceptions as signals, stabilising controls, then automating safely.

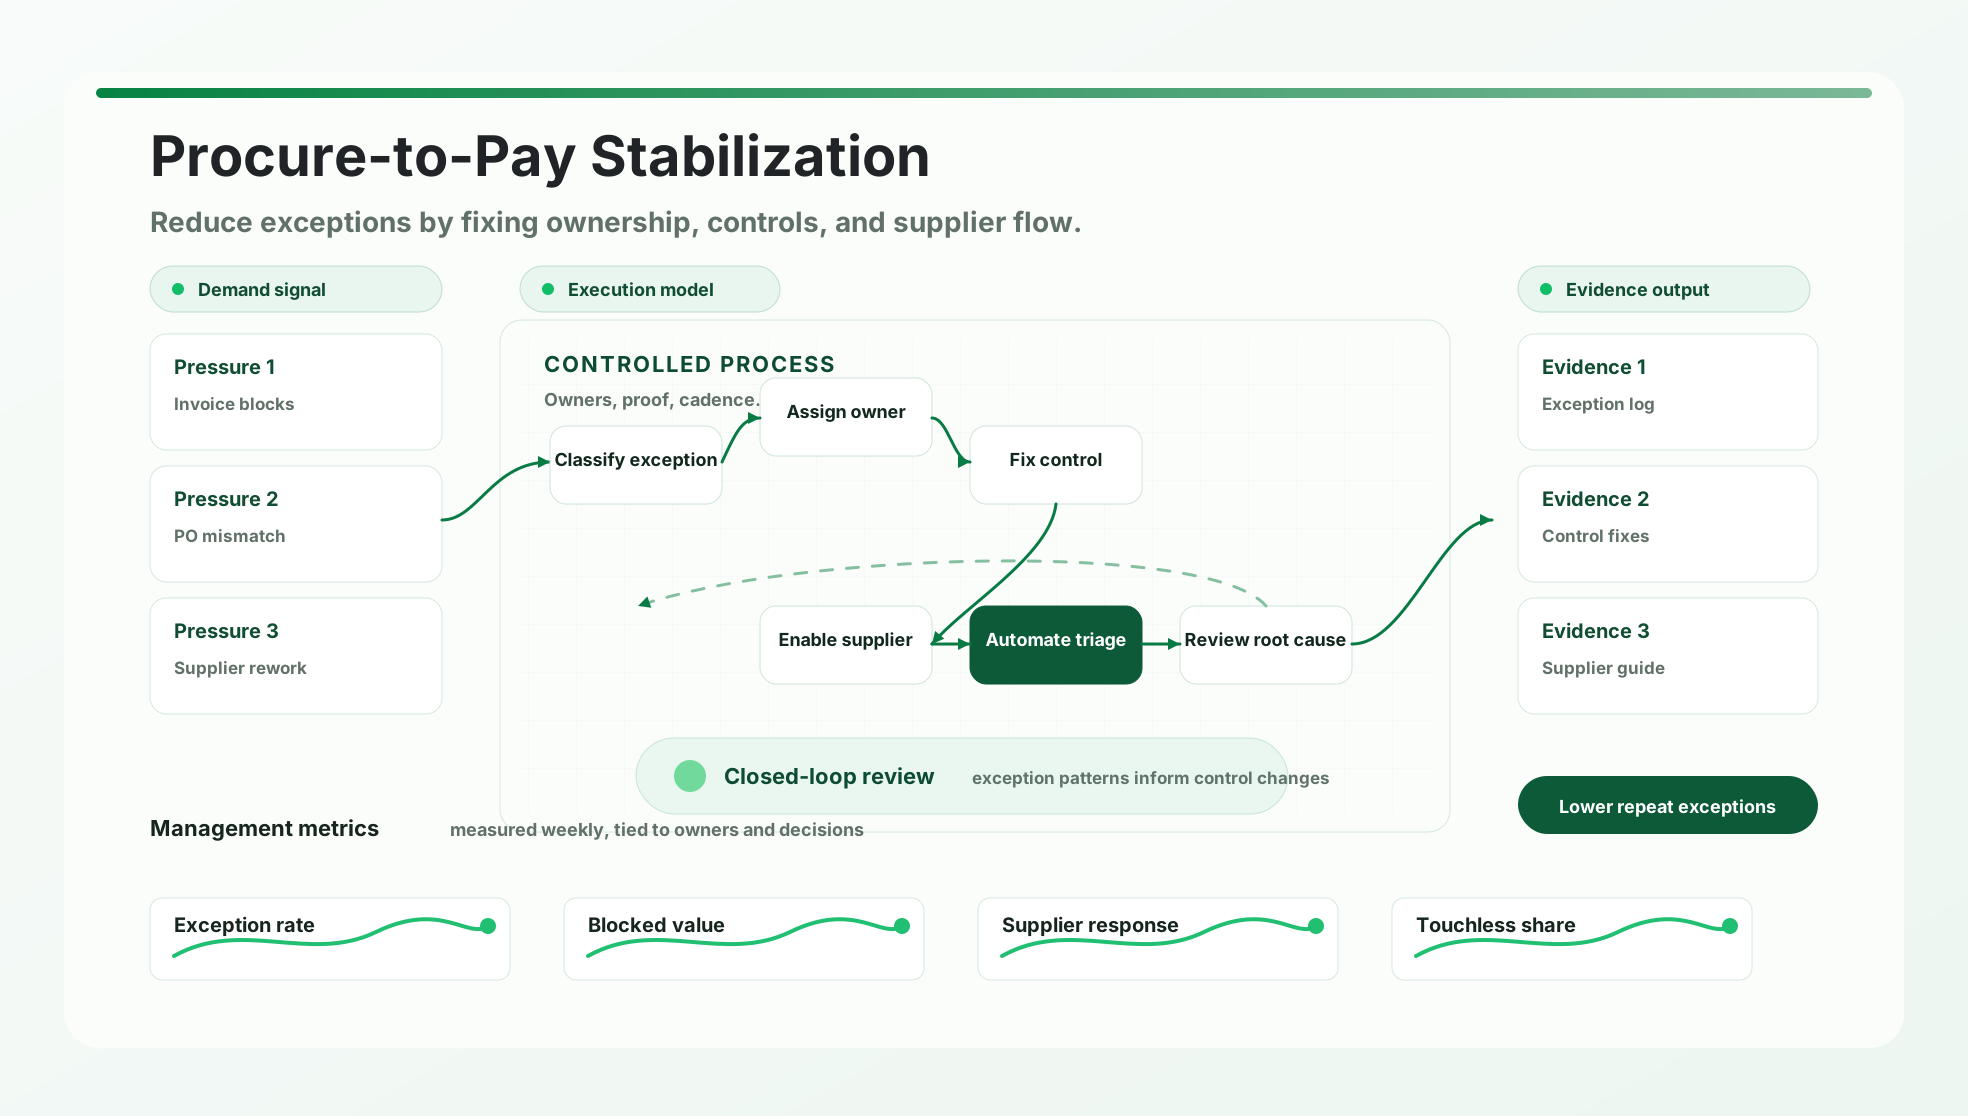
P2P root-cause system

Treat exceptions as a financed improvement backlog

Classify recurring exceptions, assign the upstream cause and control owner, verify the fix, then automate repeatable handling within defined limits.

  1. 01 • CaptureReason code

    PO, receipt, master data, tax or approval

  2. 02 • AnalyseRoot cause

    Policy, process, data, supplier or system

  3. 03 • AssignControl owner

    Corrective action, SLA and evidence

  4. 04 • VerifyRecurrence test

    Cohort trend and control performance

  5. 05 • AutomateBounded handling

    Triage, summary and approved communications

Illustrative applicationRepeated no-PO invoice exceptions
Starting point
AP clears invoices one by one while request routing and supplier instructions continue creating the same exception.
Management intervention
Separate genuine emergencies from route failures, fix the buying path and track recurrence by business unit and supplier cohort.
Acceptance evidence
The cause declines for eight weeks, payment controls remain effective and automated triage cites the source record.
Strategic analysis

What management should take from the case

Each finding connects an observed business signal to a decision, owner or allocation choice.

01

Exception volume is a cost allocation signal

Manual resolution in AP often reflects upstream failures owned by buying channels, receiving or master data.

Management decisionAssign improvement funding and accountability to the function creating the repeat cause.
02

Touchless rate can reward weak control

A higher straight-through rate is useful only when duplicate, tax, approval and bank controls remain effective.

Management decisionPair automation measures with control failures and prevented-loss indicators.
03

Supplier cohorts need different interventions

Channel, invoice format and master-data quality concentrate failures in identifiable supplier groups.

Management decisionSequence enablement by avoidable exception volume and payment impact.
Implementation evidence

Operating models and delivery artefacts

Anonymised working assets used to define decisions, configure the workflow and transfer ownership into operations.

Invoice exceptions taxonomy diagram
Operating artefact

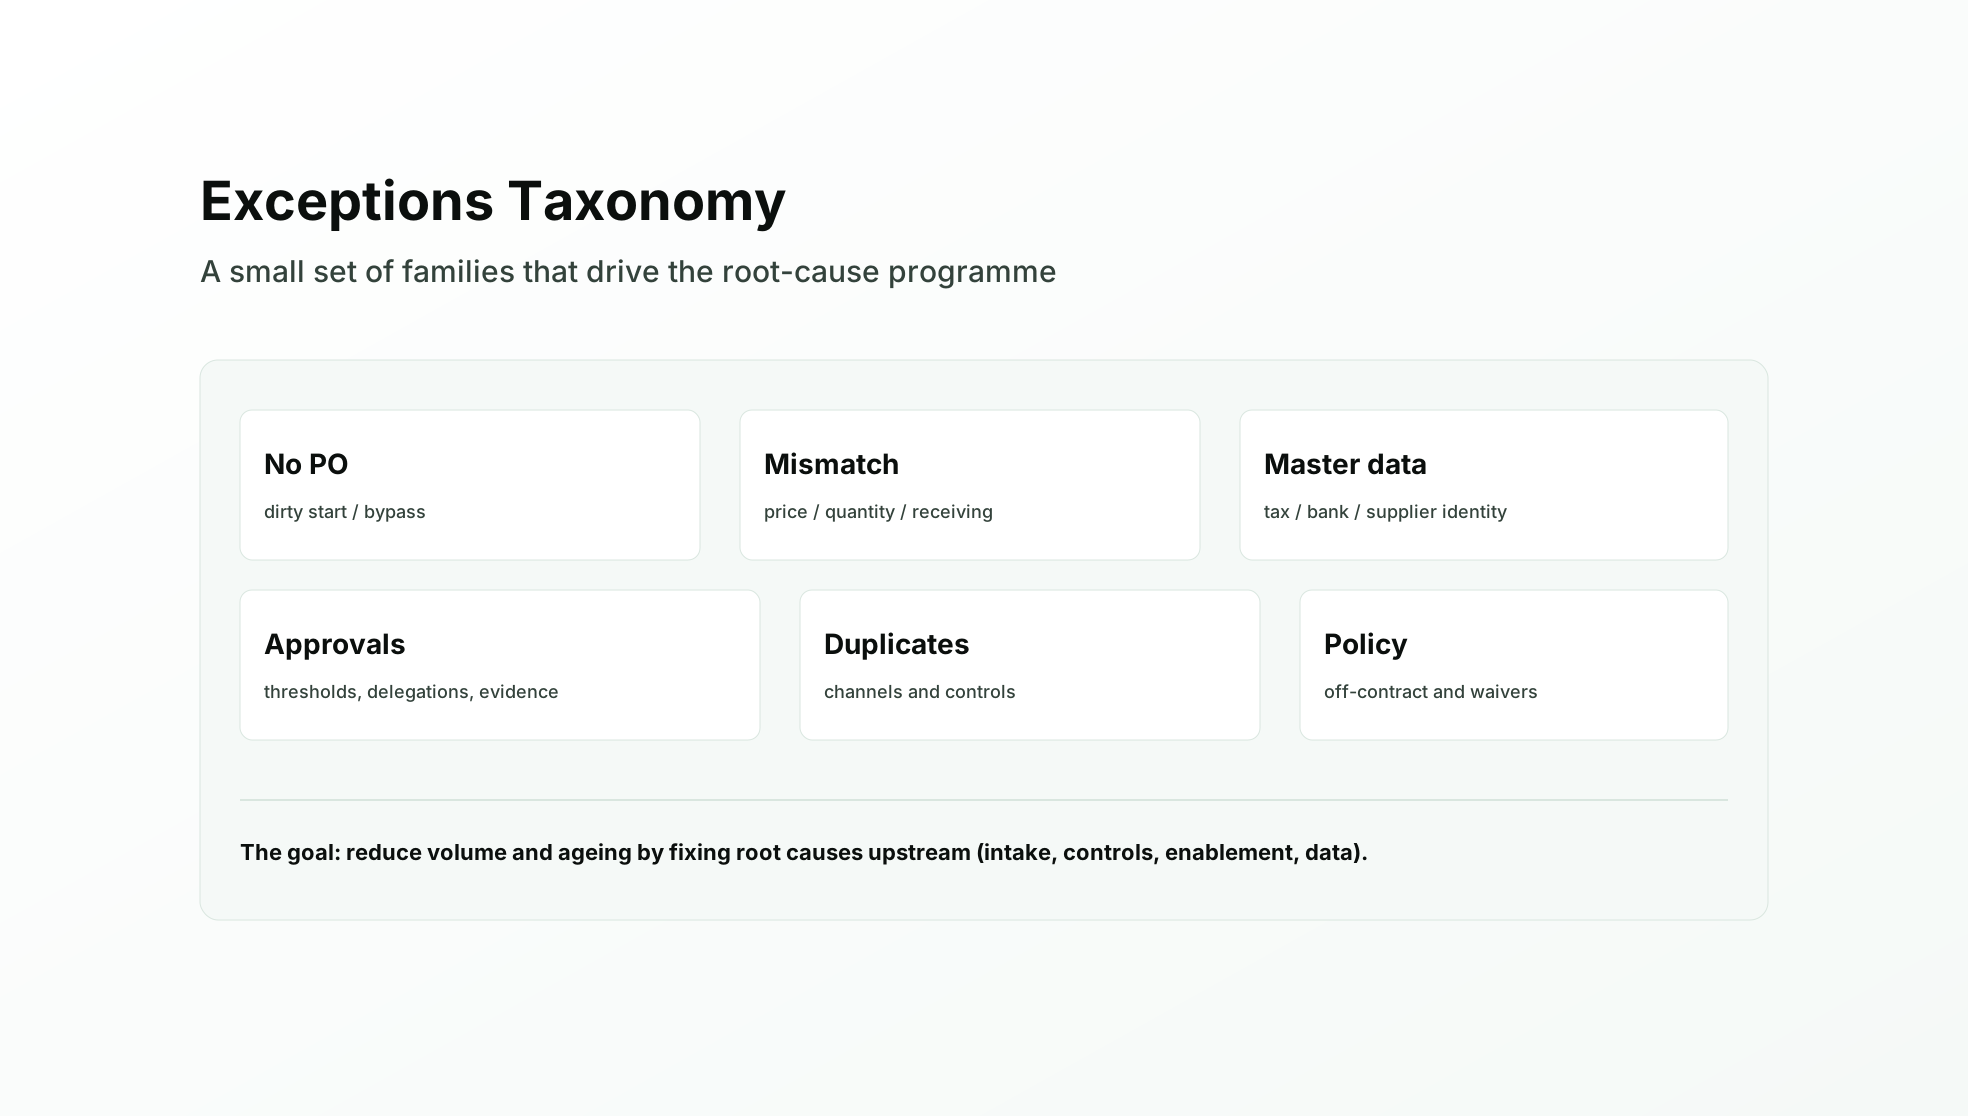
Classify exceptions as control signals

A small exception taxonomy lets leaders quantify recurring causes, assign ownership and fund the fixes with the largest operational effect.

The exception taxonomy covers No PO, mismatch, master data, approvals, duplicates, and policy breaches.

WorkflowEvidenceCadence
Integration and controls map for procure-to-pay
Operating artefact

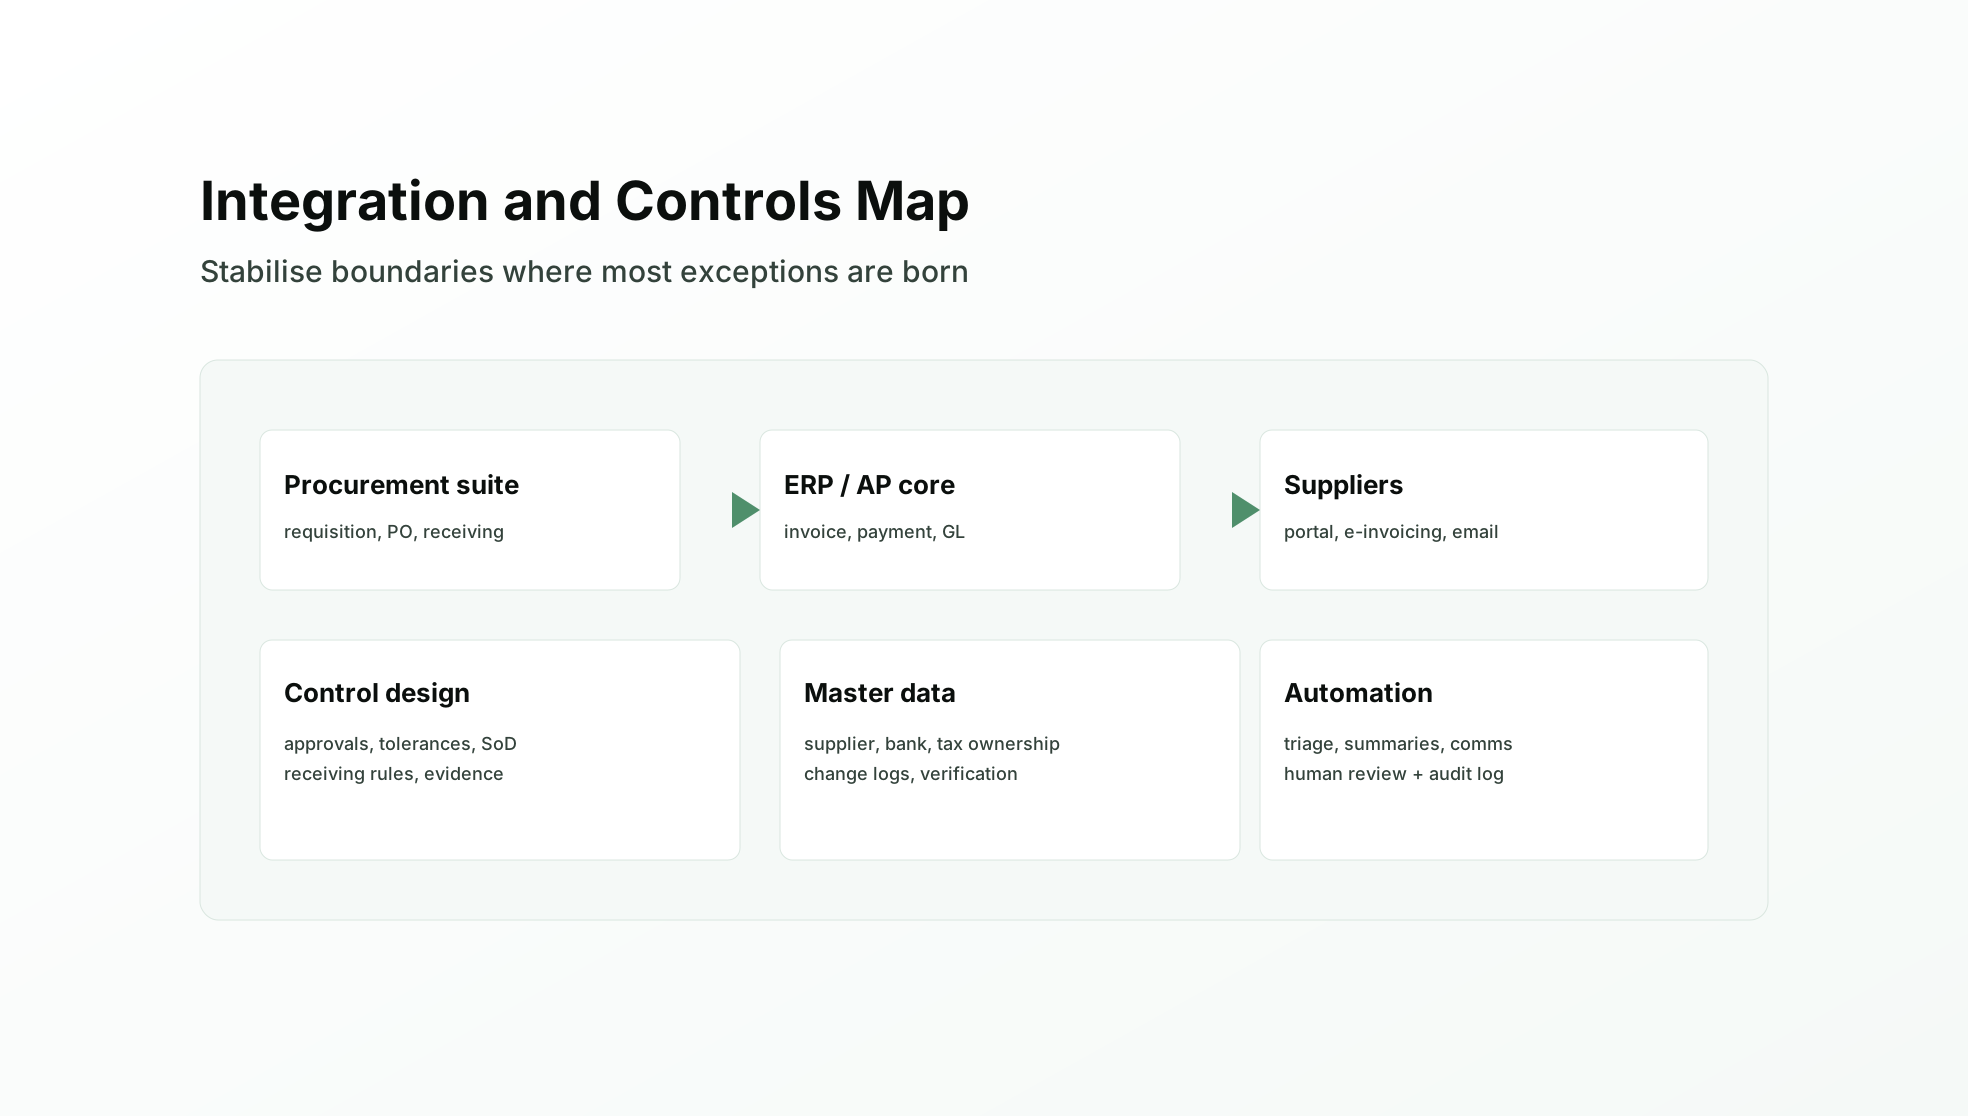
Integration and controls map

Most P2P pain sits at boundaries: procurement suite, ERP, AP tools, supplier channels, bank verification, and master data stewardship.

Stabilise first, then automate. Automation on broken controls multiplies exceptions.

WorkflowEvidenceCadence

Operating problem

  • • High exception volume with unclear ownership and inconsistent resolution paths
  • • No-PO and mismatch issues created friction, delayed payments, and escalations
  • • Supplier onboarding and master data changes were inconsistent and hard to audit
  • • Approval rules became inconsistent over time, with different thresholds, delegations, and evidence requirements
  • • Teams attempted automation before controls were stable, amplifying errors

Delivery approach

  • • Treat exceptions as signals: build a small taxonomy and baseline the top drivers
  • • Reset control design (approvals, tolerances, receiving) and define exception SLAs with owners
  • • Fix the front door: guided buying and intake routing to reduce dirty starts
  • • Bridge business and vendors/SIs: turn policy into implementable configuration and integration requirements
  • • Use agents for triage, summaries, and communication drafts with source links and named reviewers

Outputs handed over

  • • Exceptions taxonomy + weekly KPI pack with root-cause themes
  • • Control design pack: approvals, tolerances, receiving rules, and evidence expectations
  • • Supplier enablement playbooks for the highest volume cohorts
  • • Master data stewardship model (ownership, change logs, and verification steps)
  • • Automation patterns and guardrails (what is auto, what requires review, what is logged)

Operational outcomes

  • • Fewer escalations through clearer exception ownership and faster follow-up
  • • Decision logs and linked evidence replaced unrecorded special-case handling
  • • Reduced rework as guided buying and intake improved upstream quality
  • • A stable baseline for a funded, continuous improvement backlog

Measures used to govern delivery

  • • Exception rate (by reason family) and exception ageing
  • • No-PO spend trend (directional, with clear definitions)
  • • Invoice cycle time (by channel and supplier cohort)
  • • Touchless/straight-through rate where applicable
  • • Supplier enablement health (first-time-right and bounce-back reasons)

Baseline to target KPIs

Targets follow measurement of exception drivers and invoice cohorts. Intake, receiving, supplier enablement and master-data fixes establish the conditions for safe automation.

MetricTypical baselineTarget after stabilisation
MetricInvoice exception rate
Typical baselineOften 15–30% (depending on channel and cohort)
Target after stabilisation≤10–15% with a root-cause programme and clear ownership
MetricInvoice cycle time
Typical baselineOften 7–12 days for high-exception cohorts
Target after stabilisation≤3–5 days for stabilised cohorts (with clear SLAs)
MetricTouchless / straight-through processing
Typical baselineLow; concentrated in a small set of supplier cohorts
Target after stabilisationExpanded through enablement + clean controls + safe automation

Baselines and targets are operating ranges used to frame discovery and acceptance. They are not presented as verified client results.

Timeline

3–4 weeks (baseline) + 6–10 weeks (delivery)

  1. 01

    Baseline (Weeks 1–2): quantify top exceptions, define owners, and agree acceptance tests

  2. 02

    Controls reset (Weeks 3–5): approvals, tolerances, receiving rules, master data stewardship, and exception SLAs

  3. 03

    Enablement (Weeks 6–8): supplier cohorts, comms, and guided buying / intake fixes to reduce dirty starts

  4. 04

    Automation (Weeks 9–12): exception triage, summaries, and comms drafts with human review and audit logging

Related service

Continue into the service page tied to this example, or compare the wider advisory offer.